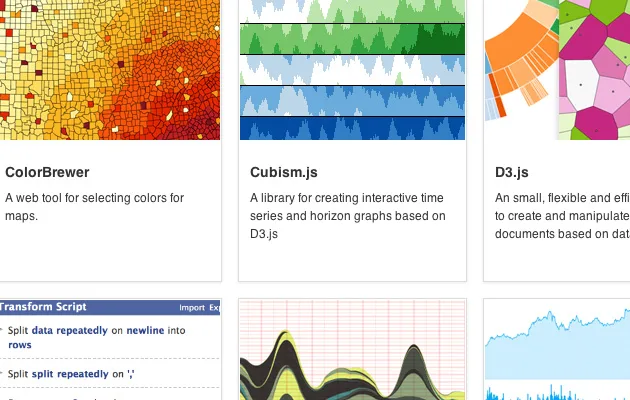
First up this week, our Swiss colleagues over at datavisualisation.ch have had the tgood sense to upload the one and only, genuine Swiss Army knife of data journalism.
Just like the famous red knife, selection.datavisualization.ch not only presents the essential tools for those wishing to play around with data, but it does so in an intelligent and ergonomic way.
Depending on what you’re looking to do, three filters allow users to sort through the tools: maps, charts or data. Best of all, with a single click you can filter your choice down to only the tools that require no programming knowledge, or conversely those suited to more experienced coders.

Policy and good practice
Staying with tools, and thanks to our friend Geoffrey Dorne for pointing out a font that could quickly become indispensable: FF Chartwell. Using Open Type technology, once installed on your system the font will transform a simple set of data into a well designed typeface.
With seven types of visualisations (bar, line, pie and others), for the price of €119 the FF Chartwell font looks like a practical and flexible tool for creating simple, beautiful and easily modifiable graphics in no time.
After all these tools, let’s talk training and techniques with Malofiej 20. The Pulitzer of the infographic world, it was created in 1993 in honour of Alexander Malofiej, an Argentine cartographer considered a dataviz pioneer. This year, as in previous years, the data experts at The New York Times have dominated the competition.
Visual.ly offer a detailed 10-point analysis of the Times work, offering up some clues as to why they’ve been so successful. Worth remembering before diving into your next data project: define a precise angle; respect your audience; be agile; and be able to use a variety of techniques…

Eat, drink, visualise!
A few months ago the US company Massive Health published the application The Eatry on the appStore. The principle is simple – take a picture of what you eat and over time discover the balance of your diet.
For the past five months, Massive Health has been gathering some 7.68 million opinions concerning a half a million foods, from over 50 countries worldwide. The application We Are What We Eat is a feast of stories derived from this data, starting with a simple world map and showing the evolution of our meals over 24 hours .

Moving into the data
More than ever, data is everywhere. And it appears that charts have become trendy. Kelquartier, a good old-fashioned startup from France, have chosen to approach the subject of real estate from a data angle. Their stated goal is to “change the world by helping the French to house themselves better and cheaper“. Wow.
The result is a cartographic visualisation engine of the “42,000 neighbourhoods and small towns of France“. Everyone can scan through the neighbourhood of their dreams from every conceivable angle: population type, average revenue, percentage who voted for François Hollande in the presidential election, high school results, fertility rates (??) and many others.

It’s strange, but this feels a little too much like “marketed voyeurism”, that might lead to more societal corporatism, not to mention partitioning. The dark side of data, perhaps.
Brittle borders
Jérôme Cukier, who by day draws with figures for the OECD, has released a nice tool for the people of Paris ahead of the next national elections in France.
Built with D3.js and based on the results of this year’s presidential elections, polling station by polling station, he has projected the data on a map divided into constituencies. The web-application goes even further, allowing everyone to play around with these constituencies and fiddle with the left/right balance in the capital.
His datavisualisation also poses a real question: what is the impact of this administrative partitioning on the final voting results? An important issue given that redrawing of constituency boundaries is a regular occurence that is often lacking in transparency.

What You See Is What You Are
A little “data art” to finish with Marcin Ignac, a Danish artist, programmer and designer. In his project Every Day of My Life, he visualises every time he has used his computer in the past 30 months.

Each line represents a day and each colour block, the main application opened during that time. The black gaps are times when the computer was switched off. It’s particularly interesting to see, year after year, the frequency of black-out areas.
And finally, to conclude this week’s edition, may we suggest a gentle melody that should be the anthem of the international dataïste.
All together now: “I like checkin’ on charts…”
Find previous editions of The Week In Data on Owni.eu
Follow OWNI’s elite data squadron on Twitter: @pdatha, @gregoirenormand, @mariecoussin, @juliengoetz & @nicolaspatte
💬 Discussion
No comments yet. Be the first to comment!